
GETTING STARTED
This tutorial is a follow on to my previous tutorial introducing HTML5 and the Geo-location API and builds upon the customization of last weeks code sample. It’s a good idea to read them first as I’ll be jumping straight in the customization section. To get us started, here is our default jQuery plugin template:
(function ( $ ) {
    $.fn.CustomMap = function( options ) {
        var settings = $.extend({
            home: { latitude: 53.339381, longitude: -6.260533 },
            text: 'Web Development Blog | DeveloperDrive',
            icon_url: 'http://www.developerdrive.com/wp-content/uploads/2013/08/ddrive.png',
            zoom: 15
        }, options );

        var coords = new google.maps.LatLng(settings.home.latitude, settings.home.longitude);

        return this.each(function() {
            var element = $(this);
        });
    };
}( jQuery ));
Here we are creating a standard jQuery plugin and defining its default settings. The default settings are a default location to center on, some text to display when the location is clicked, the default zoom and a custom icon to represent the location.
As previously shown, adding a Google Map is quiet easy. All you need to provide is the default options for it and initialize a new Map object. By default, we are going to center on the co-ordinates provided by the plugin options. We are also going to sho the default controls and set the style of map to ROADMAP. The available types of map are:
- Hybrid
- Roadmap
- Satellite
- Terain
The definition of each type is available here. It is also possible to change the default control to either a drop down or a horizontal bar. To do this you can specify a custom MapTypeControlStyle object.
var options = {
    zoom: settings.zoom,
    center: coords,
    mapTypeId: google.maps.MapTypeId.ROADMAP,
    mapTypeControl: true,
    scaleControl: true,
    zoomControlOptions: {
        style: google.maps.ZoomControlStyle.DEFAULT
    },
    overviewMapControl: true,
};

var map = new google.maps.Map(element[0], options);
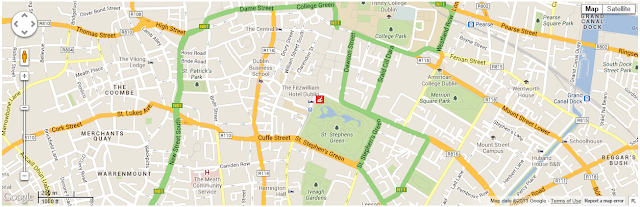
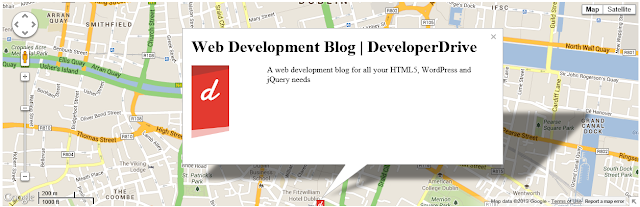
We also saw last week how easy it was to add a custom marker to the map, this week we are also going to add some custom text that appears when the marker is clicked. To do this we use the InfoWindow class. Here we set the content to the value passed into our plugin, but this can be full HTML content not just plain text. This means you can add more complex content such as images, like this:
var settings = $.extend({
    home: { latitude: 53.339381, longitude: -6.260533 },
    text: '<div class="map-popup"><h1>Web Development Blog | DeveloperDrive</h1><br/><div class="logo"><img src="http://developerdrive.developerdrive.netdna-cdn.com/wp-content/themes/dd_flat/images/logor.png" /></div><div class="about">A web development blog for all your HTML5, WordPress and jQuery needs</div></div><div class="clear"></div>',
    icon_url: 'http://www.developerdrive.com/wp-content/uploads/2013/08/ddrive.png',
    zoom: 15
}, options );
Since the above HTML is rendered on screen, it is possible to use CSS to style it whatever way you want.
div.map-popup {
    position: relative;
}

div.map-popup h1{
    margin: 0px;
}

div.map-popup > div {
    display: inline-block;
}

div.map-popup div.logo {
    width: 25%;
    float: left;
}

div.map-popup div.about {
    float: right;
    width: 75%;
}

.clear {
    clear: both;
}
Once we have our info window defined, we need to attach a click event to the map to actually display the information content. To do this, we use the addListener function, specify the marker we want to attach the event to, the type of event and the function to call. Then it is as simple as calling .open method on the info object.
var icon = {
    url: settings.icon_url,
    origin: new google.maps.Point(0, 0)
};

var marker = new google.maps.Marker({
    position: coords,
    map: map,
    icon: icon,
    draggable: false
});

var info = new google.maps.InfoWindow({
    content: settings.text
});

google.maps.event.addListener(marker, 'click', function() {
    info.open(map, marker);
});
Now that we have our basic map complete, we can start customizing it. To actually style it we must build up an array of styles, each style is applied to a specific feature or all features. It is possible to specify the:
- Color
- Gamma
- Hue
- Lightness
- Weight
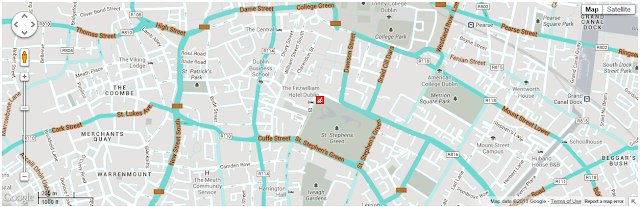
A typical style will look something like this. Here we are stating that the feature we wish to style is of type road, and that we wish to style it’s geometry (e.g. the lines drawn that represent a road). The actual style is defined by the stylers property and here we are setting the hue and saturation so that the roads appear a bright blue
{
    featureType: "road",
    elementType: "geometry",
    stylers: [
        { hue: "#00ffee" },
        { saturation: 50 }
    ]
}
In this one we are specify that road labels are a brown color.
{
    featureType: "road",
    elementType: "labels",
    stylers: [
        { hue: "#4f2a0b" },
        { saturation: 50 }
    ]
}
The aim is to build up a collection of these rules or styles for each element/feature you wish to change. A full list of features is available here. For this tutorial, we are going to style the schools and parks as well as the roads already styled. Here I am only specifying colors or shades, but you can provide styles for sub components of the geometery and label types. For example you can override a labels icon color by using the element type ‘labels.icon’;
var styles = [{
        featureType: "all",
        stylers: [
          { saturation: -80 }
        ]
    },{
        featureType: "road",
        elementType: "geometry",
        stylers: [
          { hue: "#00ffee" },
          { saturation: 50 }
        ]
    }, {
        featureType: "road",
        elementType: "labels",
        stylers: [
            { hue: "#4f2a0b" },
            { saturation: 50 }
        ]
    }, {
        featureType: 'poi.school',
        elementType: 'geometry',
        stylers: [
            { hue: '#4f2a0b' },
            { lightness: -15 },
            { saturation: 99 }
        ]
    }, {
        featureType: 'poi.park',
        elementType: 'geometry',
        stylers: [
            { hue: '#a3e36b' },
            { lightness: -15 },
            { saturation: 99 }
        ]
    }, {
        featureType: 'poi.park',
        elementType: 'labels.icon',
        stylers: [
            { hue: '#450b4f' },
            { lightness: -15 },
            { saturation: 99 }
        ]
    }
];
Once you have your collection of styles, you can simply call the setOptions method on your map and pass in the the styles collection
map.setOptions({styles: styles});
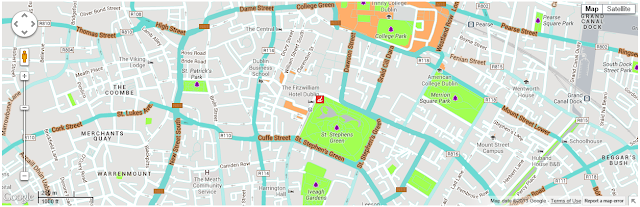
I hope you’ve found the above useful in creating your own custom map. The Google API documentation is pretty verbose, and there are plenty of other options available for you to style and customize. You can find all of the options available to you here. I should also probably apologize for the horrific colors I chose, they were picked to make it easier to see what was being styled rather than their aesthetic.
The plugin can be initialized using the following code
jQuery(document).ready(function() {
    jQuery('div.location').CustomMap();
});
and the final plugin looks like this:
(function ( $ ) {
    $.fn.CustomMap = function( options ) {
        var settings = $.extend({
            home: { latitude: 53.339381, longitude: -6.260533 },
            text: '<div class="map-popup"><h1>Web Development Blog | DeveloperDrive</h1><br/><div class="logo"><img src="http://developerdrive.developerdrive.netdna-cdn.com/wp-content/themes/dd_flat/images/logor.png" /></div><div class="about">A web development blog for all your HTML5, WordPress and jQuery needs</div></div><div class="clear"></div>',
            icon_url: 'http://www.developerdrive.com/wp-content/uploads/2013/08/ddrive.png',
            zoom: 15
        }, options );

        var coords = new google.maps.LatLng(settings.home.latitude, settings.home.longitude);

        return this.each(function() {
            var element = $(this);

            var options = {
                zoom: settings.zoom,
                center: coords,
                mapTypeId: google.maps.MapTypeId.ROADMAP,
                mapTypeControl: true,
                scaleControl: true,
                zoomControlOptions: {
                    style: google.maps.ZoomControlStyle.DEFAULT
                },
                overviewMapControl: true,
            };

            var map = new google.maps.Map(element[0], options);

            var icon = {
                url: settings.icon_url,
                origin: new google.maps.Point(0, 0)
            };

            var marker = new google.maps.Marker({
                position: coords,
                map: map,
                icon: icon,
                draggable: false
            });

            var info = new google.maps.InfoWindow({
                content: settings.text
            });

            google.maps.event.addListener(marker, 'click', function() {
                info.open(map, marker);
            });

            var styles = [{
                    featureType: "all",
                    stylers: [
                      { saturation: -80 }
                    ]
                },{
                    featureType: "road",
                    elementType: "geometry",
                    stylers: [
                      { hue: "#00ffee" },
                      { saturation: 50 }
                    ]
                }, {
                    featureType: 'poi.school',
                    elementType: 'geometry',
                    stylers: [
                        { hue: '#4f2a0b' },
                        { lightness: -15 },
                        { saturation: 99 }
                    ]
                }, {
                    featureType: 'poi.park',
                    elementType: 'geometry',
                    stylers: [
                        { hue: '#a3e36b' },
                        { lightness: -15 },
                        { saturation: 99 }
                    ]
                }, {
                    featureType: 'poi.park',
                    elementType: 'labels.icon',
                    stylers: [
                        { hue: '#450b4f' },
                        { lightness: -15 },
                        { saturation: 99 }
                    ]
                }
            ];

            map.setOptions({styles: styles});
        });

    };
}( jQuery ));


Post a Comment